Analytics — CleverlyBox · See exactly what's working. And what's not.
Analytics / Reporting

See exactly what's working.
And what's not.

Open rates, clicks, revenue, bounces, unsubscribes — everything in one place. Filter, compare, and drill into the metrics that matter so you can grow what works and fix what doesn't.

Opens
Clicks
Bounces
Unsubs
The reporting problem

Mainstream ESP dashboards tell you the headline. Not the story.

Open rate is a number. But which countries opened? Which ISPs delivered? Which links got clicked? Which subscribers are about to churn? Most platforms hide the answers behind enterprise plans or never collect the data in the first place.

Mailchimp dashboard limits

Surface-level reports only

Open / click / unsub — and that's where the report ends. No ISP breakdown unless you upgrade. No raw logs. No SQL access. You see the trailer, not the movie.

Geographic blindness

No country-level heatmap

You don't know if 70% of opens came from one country. So you keep sending the same time-of-day everywhere. Time-zone optimization is impossible without geo data and most ESPs don't surface it at all.

No ISP visibility

Are you in spam at Gmail?

Without ISP breakdown you can't tell if Gmail is delivering, Yahoo is bouncing, and Outlook is junking you. The aggregate looks fine. The reality is: you've lost half your inbox at one provider and you have no idea.

Campaign analytics

Every campaign, every metric, one screen.

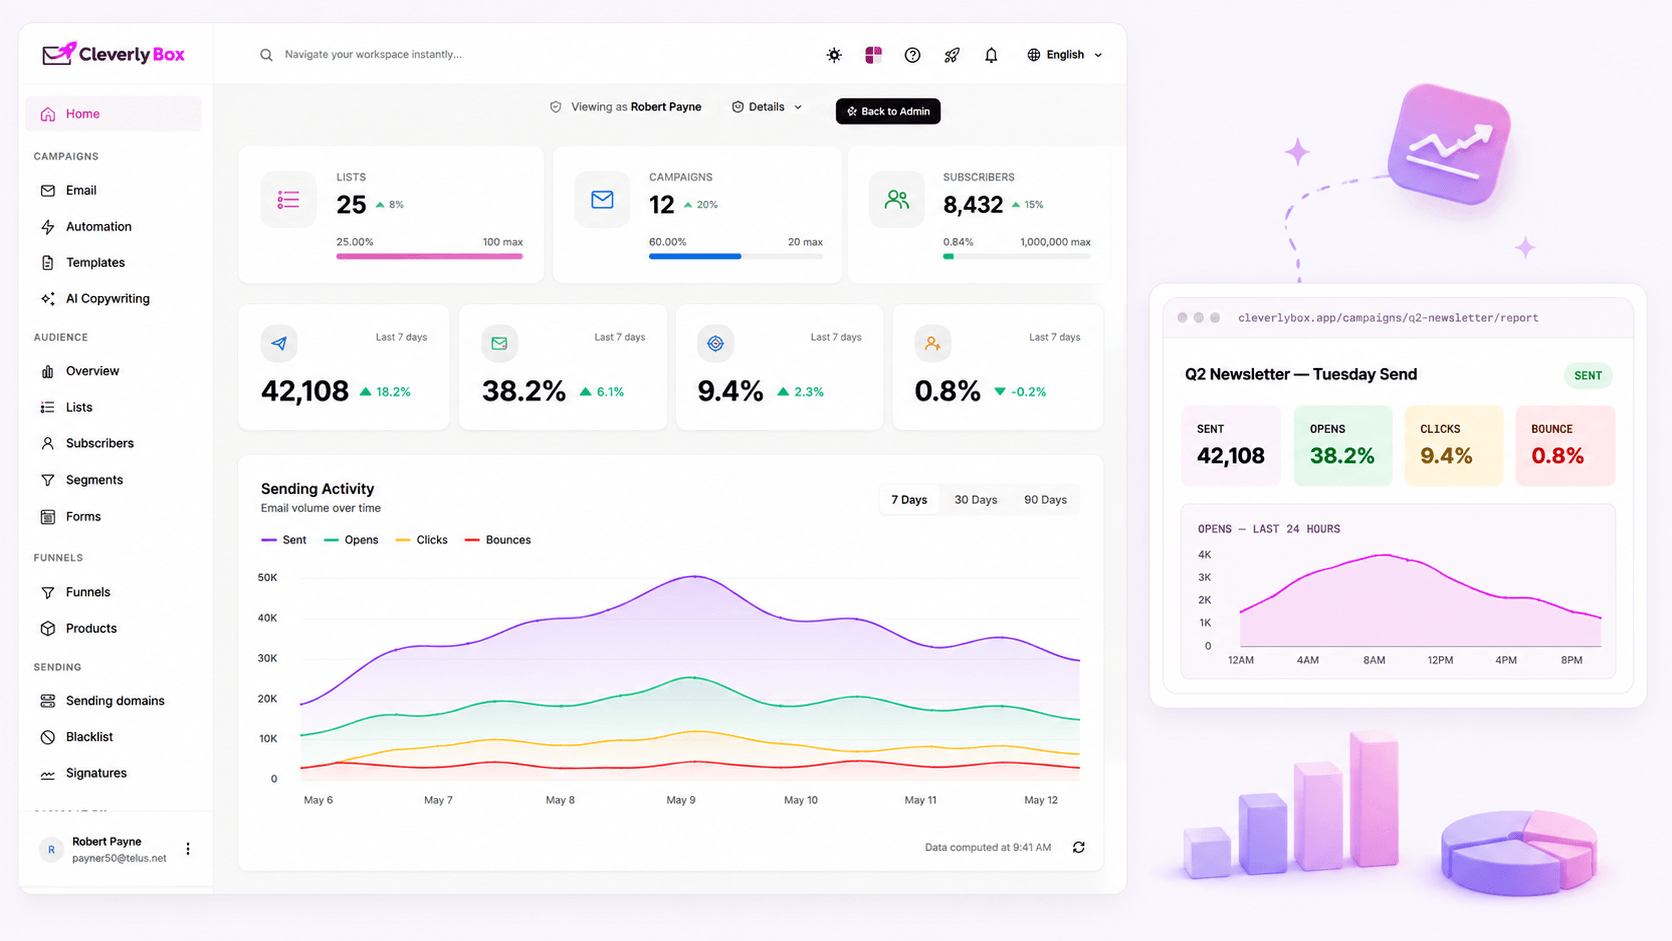
Pull up a sent campaign and get the full vitals opens, clicks, bounces, unsubscribes, complaint rate, click-through rate, conversion rate. With time-of-day breakdowns, day-of-week patterns, and date-range filtering when you want to compare last week's send to today's.

  • Total sent, delivered, opened, clicked, bounced, unsubscribed
  • Open rate, click-through rate, click-to-open rate, bounce rate
  • Date-range filter — slice by hour, day, week, custom window
  • Compare two campaigns side-by-side
  • Per-subscriber engagement timeline
  • CSV export of every metric
Geographic heatmap

Country-level open data. Time-zone targeting becomes possible.

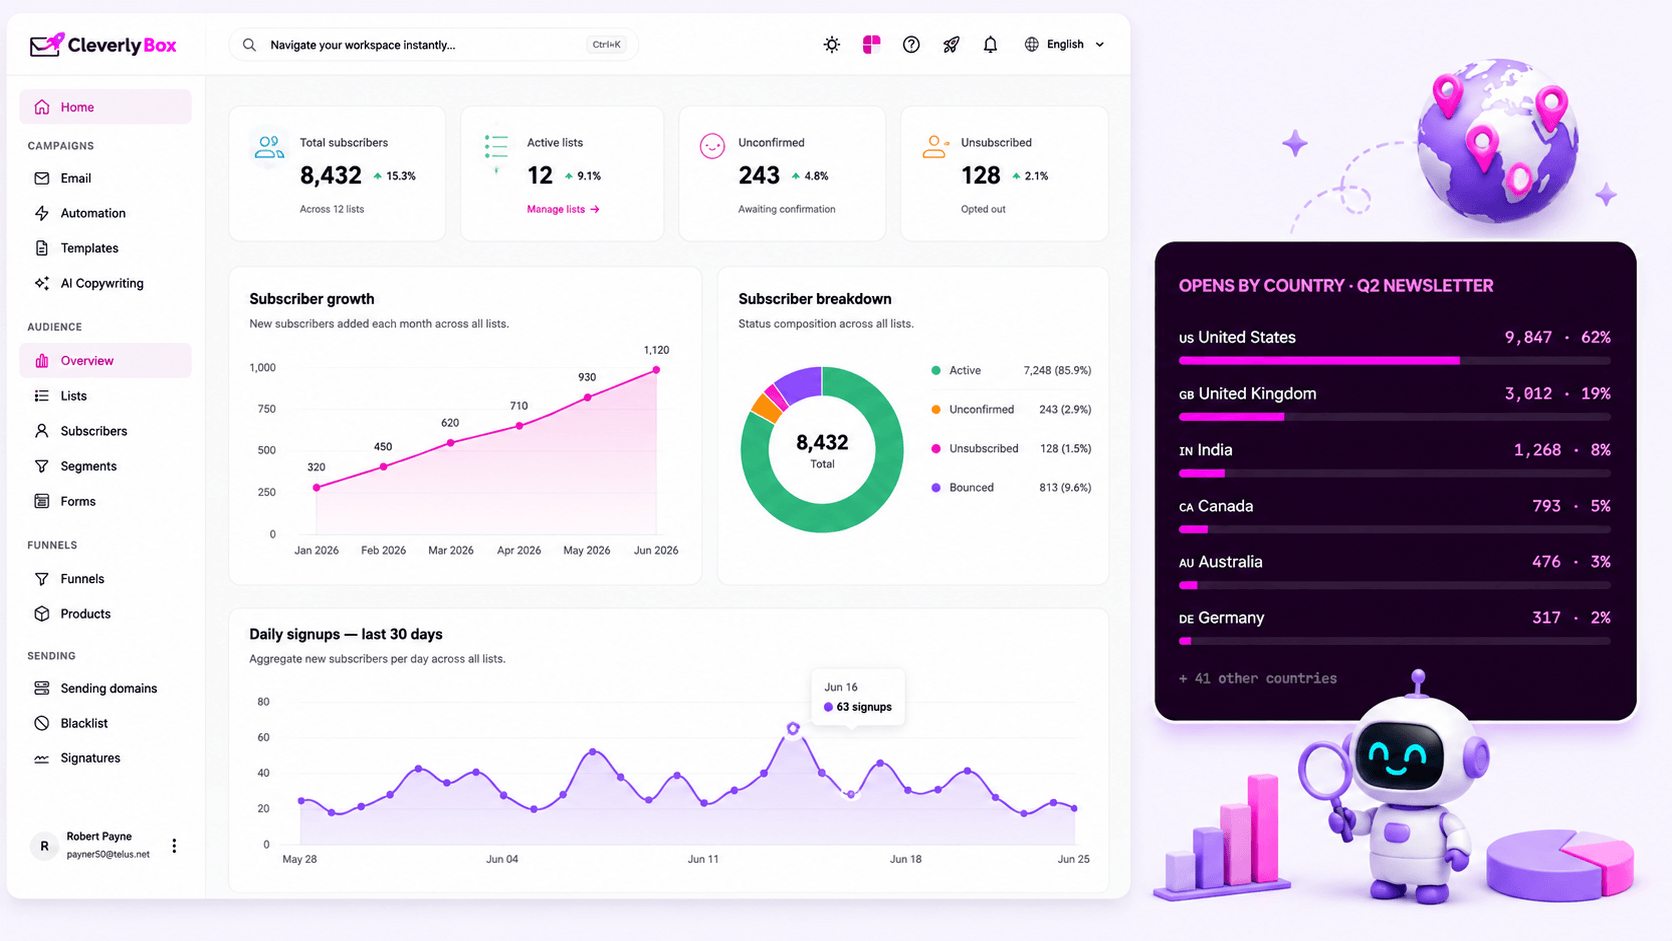
Where are your opens actually coming from? CleverlyBox tracks IP-resolved geo at country level on every open. So when 62% of your opens are US and 19% are UK and 8% are India, you can stop sending at one global time and start sending three localized waves.

  • Country-level aggregation on every open
  • Top 10 countries by open count + open rate
  • Compare your geo distribution vs your subscriber list distribution
  • Find regional anomalies is Brazil suddenly 3x?
  • Inform send-time scheduling and segmentation
Inbox placement rate

Gmail. Yahoo. Outlook. Corporate. Track each one separately.

Aggregate open rate is a lie when one ISP is delivering at 45% and another is junking at 8%. CleverlyBox parses every recipient domain and groups it by provider so you can spot the moment Gmail starts spam-foldering you while Yahoo is still inbox.

Provider Sent Inbox Spam Promos % Inbox
Gmail 24,481 18,651 2,184 3,846 75.8%
Outlook 9,431 6,642 1,037 1,657 72.3%
Yahoo 3,716 2,211 540 367 71.8%
Corporate / O365 6,184 4,575 823 788 74.0%
Other 1,245 912 167 166 72.1%
View full deliverability report
A/B subject line testing

Which line got the click? Which one got ignored?

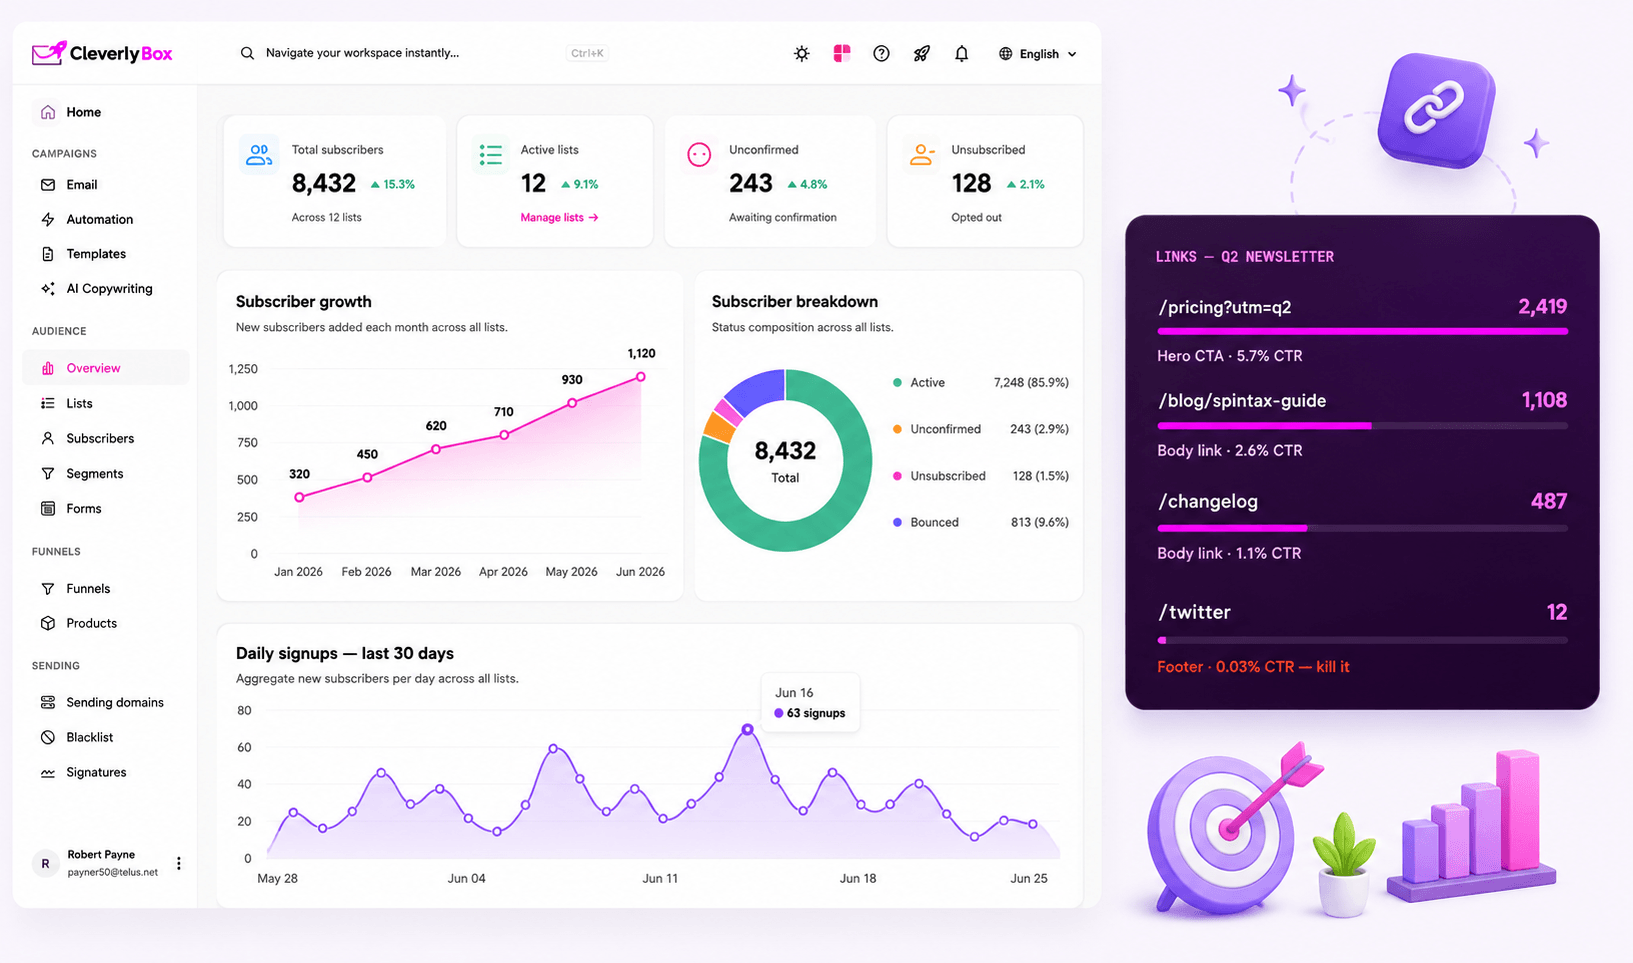
Every URL in your campaign is wrapped, tracked, and reported. The CampaignLink table records every click — which link, which subscriber, which time, which user-agent, which referer. Sort by click count to find the winners. Sort by zero-click to find dead weight.

  • Per-link click count + click rate
  • Click breakdown by subscriber segment
  • Top performing CTAs across campaigns
  • Identify dead links — links that never get clicked
  • UTM-aware — click data flows downstream to your analytics tool
  • Click heatmap on the email itself
Content insights

Subject line splits. Content cliffs. Statistical significance built in.

See what works and what doesn't. Content clicks, link heatmaps, and statistical confidence help you make better decisions.

  • Top link clicks by position
  • Content cliff performance
  • Split test confidence
  • Statistical significance built-in
  • Auto-detect winning variations
Event-level tracking

Every event captured. Queryable. Exportable. Yours.

Behind the dashboard sit five log tables ClickLog, OpenLog, BounceLog, FeedbackLog, TrackingLog. Every event is row-stored with subscriber ID, campaign ID, timestamp, IP, user-agent, and event-specific metadata. Query them via the API. Export to CSV. Pipe into your warehouse. Build whatever dashboard you actually want.

OpenLog Every open event — subscriber, campaign, timestamp, IP, user-agent, geo. Pixel-tracked + image-load tracked. Multiple opens per recipient captured separately.
ClickLog Every click — subscriber, campaign, link URL, timestamp, IP, user-agent. Joined to CampaignLink for per-link aggregation. Tracks click position when available.
BounceLog Every bounce — soft / hard / OOO classified by the bounce handler. Includes bounce reason from the SMTP response, so you know if it was reputation, mailbox-full, or invalid.
FeedbackLog FBL complaints — when a recipient hits "Spam" at AOL / Yahoo / Microsoft, the FBL handler logs it here. Auto-unsubscribes the subscriber. Tracks complaint rate per campaign.
TrackingLog Raw per-event tracking pings. Useful for debugging — when an open didn't fire, when a click didn't register, the TrackingLog shows the raw event before it was classified.
API + webhook export Hit the REST API to query any log table. Or subscribe to webhooks — every open, click, bounce, feedback fires an event you can route to your warehouse, CRM, or product analytics.
Export + integrations

Get your data out. We don't hold it hostage.

Most ESPs treat your event data like proprietary IP. Want to query it in BigQuery, Snowflake, or Redshift? Pay for the enterprise tier. CleverlyBox ships export from day one every dashboard has a CSV button, every log table has an API endpoint, every webhook can pipe events live to your warehouse.

  • Export to CSV, Excel, JSON
  • Google Sheets integration
  • BigQuery / Snowflake export
  • Webhooks for real-time events
  • REST API access
 
  {
  "event": "opens.created",
  "campaign_id": "cmp_q2_newsletter",
  "subscriber_id": "sub_8f2a1b9c",
  "email": "alex@acme.com",
  "timestamp": "2026-05-08T14:22:31Z",
  "ip": "203.0.113.42",
  "user_agent": "Mozilla/5.0...",
  "geo": {
    "country": "US",
    "region": "NY"
  },
  "isp": "Gmail"
}
View API docs
Endpoint that matters

Side-by-side: what you actually get.

Dashboard, transparent comparisons, real features. No fluff.

Feature CleverlyBox Mailchimp ConvertKit SendGrid
Real-time dashboard × × ×
Country & timezone data Limited × ×
Inbox placement by provider Limited × ×
Subject line A/B tester Limited ×
Content splits & cliffs Limited ×
Export raw events Limited ×
API & Webhooks Limited Limited Limited
One-time payment $49 one-time Starts at $15/mo Starts at $15/mo Starts at $15/mo
Included Limited Not included
FAQ

Questions about reporting, logs,
and exports.

Yes. Every email gets a 1×1 transparent tracking pixel inserted before send. When the recipient's mail client loads images, the pixel request fires and we log an OpenLog event with subscriber ID, campaign ID, timestamp, IP, user-agent, and resolved geo. Apple Mail Privacy Protection (MPP) inflates Apple opens we capture them, but you can filter by user-agent if you want to exclude MPP-loaded opens from your conversion math.

Country-level by default. We resolve the IP to a country on every open and store it in OpenLog. City-level is available via the raw IP you can run any GeoIP database on the exported logs to enrich beyond country if you need it. The dashboard shows country-level distribution, top 10 countries, and per-campaign breakdowns.

Combination. We classify by recipient domain (gmail.com → Gmail, yahoo.com / aol.com → Yahoo/AOL, outlook.com / hotmail.com / live.com → Outlook), and we resolve corporate domains via MX records to identify Google Workspace and Microsoft 365 hosting. Long-tail and self-hosted domains group into "Other" with raw counts available.

Yes — three ways. (1) CSV export from any report page. (2) REST API — paginated GET endpoints for OpenLog, ClickLog, BounceLog, FeedbackLog, TrackingLog with date-range and campaign filters. (3) Live webhooks — subscribe to opens.created, clicks.created, bounces.created, feedbacks.created, unsubscribes.created and we POST every event to your endpoint within seconds. Build the warehouse pipe you want.

A/B subject and content splits are available on Pro tier ($79) and Agency tier ($149). Starter ($49) gets full reporting, geographic heatmap, ISP breakdown, and link-level click stats — but split testing is gated to Pro+. If you upgrade later, your existing campaign data stays intact.

Indefinitely on the live database. The full log tables (OpenLog, ClickLog, BounceLog, FeedbackLog, TrackingLog) are queryable via API and CSV export for the lifetime of your account. If you self-host (Agency tier with on-prem option), retention is whatever your DB allows.

Yes. Click any subscriber to see their full engagement timeline every campaign they received, opened, clicked, bounced from, and unsubscribed from. Useful for sales handoff (which leads are warm), sunset policies (who hasn't opened in 90 days), and personalized re-engagement campaigns.

TrackingLog stores raw, unclassified ping events every hit on the tracking pixel or click redirect, before classification. OpenLog and ClickLog store classified events ready for reporting. TrackingLog is mostly for debugging "why didn't this open fire?" can usually be answered by querying TrackingLog directly. Most users never touch it.
Ready to get the full picture?

Stop guessing. Start reading the receipts.

Country-level geo. ISP-level delivery. Per-link clicks. Five log tables. CSV export. Webhook stream. All in. $49 once.

One-time payment 30-day money-back guarantee Cancel anytime